Open it
On the Overview dashboard, click the Profit & Loss YTD or Receivables (AR) card, or Full Dashboard →. The Fiscal Year, Period and Live controls work as described there.
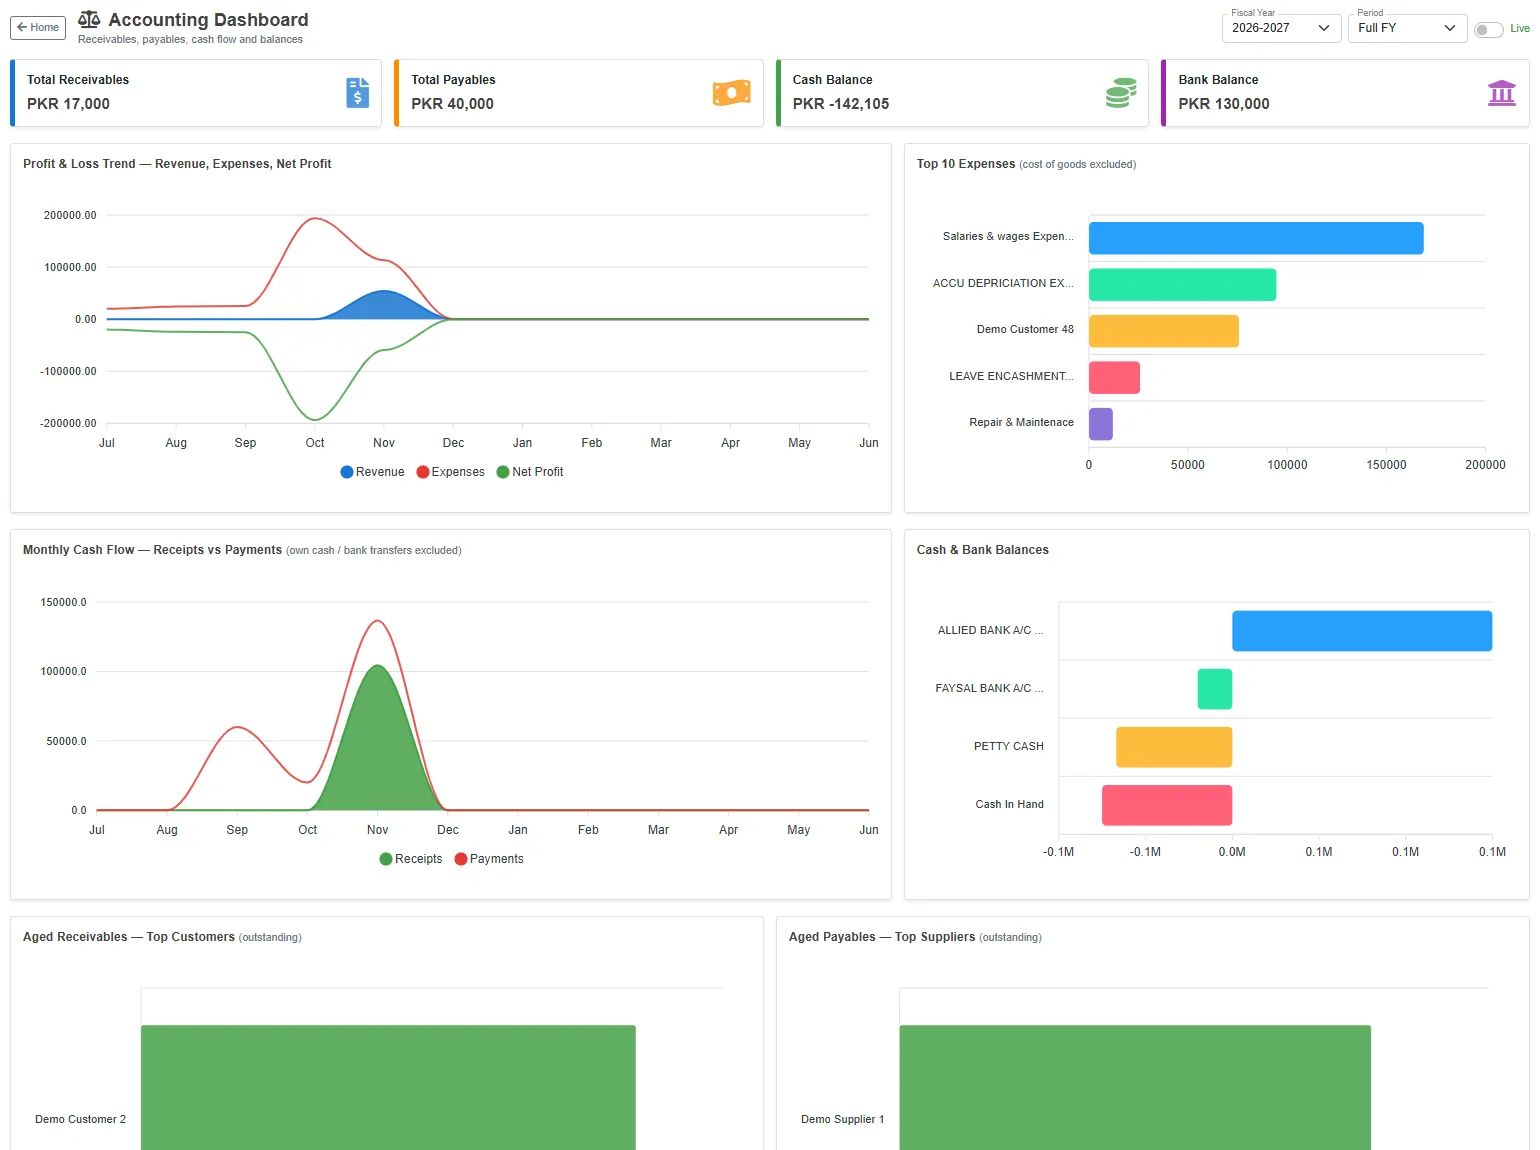
The cards
| Card | What it shows |
|---|---|
| Total Receivables | The total of customers with a debit balance, as at the end of the period. |
| Total Payables | The total of suppliers with a credit balance. |
| Cash Balance | The total of the cash accounts. A minus figure means more was paid out than the books show received. |
| Bank Balance | The total of the bank accounts. |
The charts
| Chart | What it shows |
|---|---|
| Profit & Loss Trend | Revenue, expenses and net profit for each month of the fiscal year. |
| Top 10 Expenses | The largest expense accounts in the period. Cost of goods sold is left out, so the other expenses can be compared. |
| Monthly Cash Flow | Money received into and paid out of cash and bank accounts each month. Transfers between your own cash and bank accounts are left out. |
| Cash & Bank Balances | The balance of each cash and bank account. A bar left of zero is an account in credit. |
| Aged Receivables — Top Customers | What the customers who owe the most still owe, split by age: 0–30, 31–60, 61–90 and 90+ days. Payments are matched to the oldest bills first. |
| Aged Payables — Top Suppliers | The same for what you owe suppliers. |
The aged balances are the same figures as the aging report. See Account reports.