Open the system and already know where you stand.
Every module opens on a dashboard built from live figures — not last month's export. Change the period, compare against last year, and see the shape of the business without asking anyone to prepare anything.
What each one puts in front of you.
Every dashboard lets you pick the period, including custom date ranges.
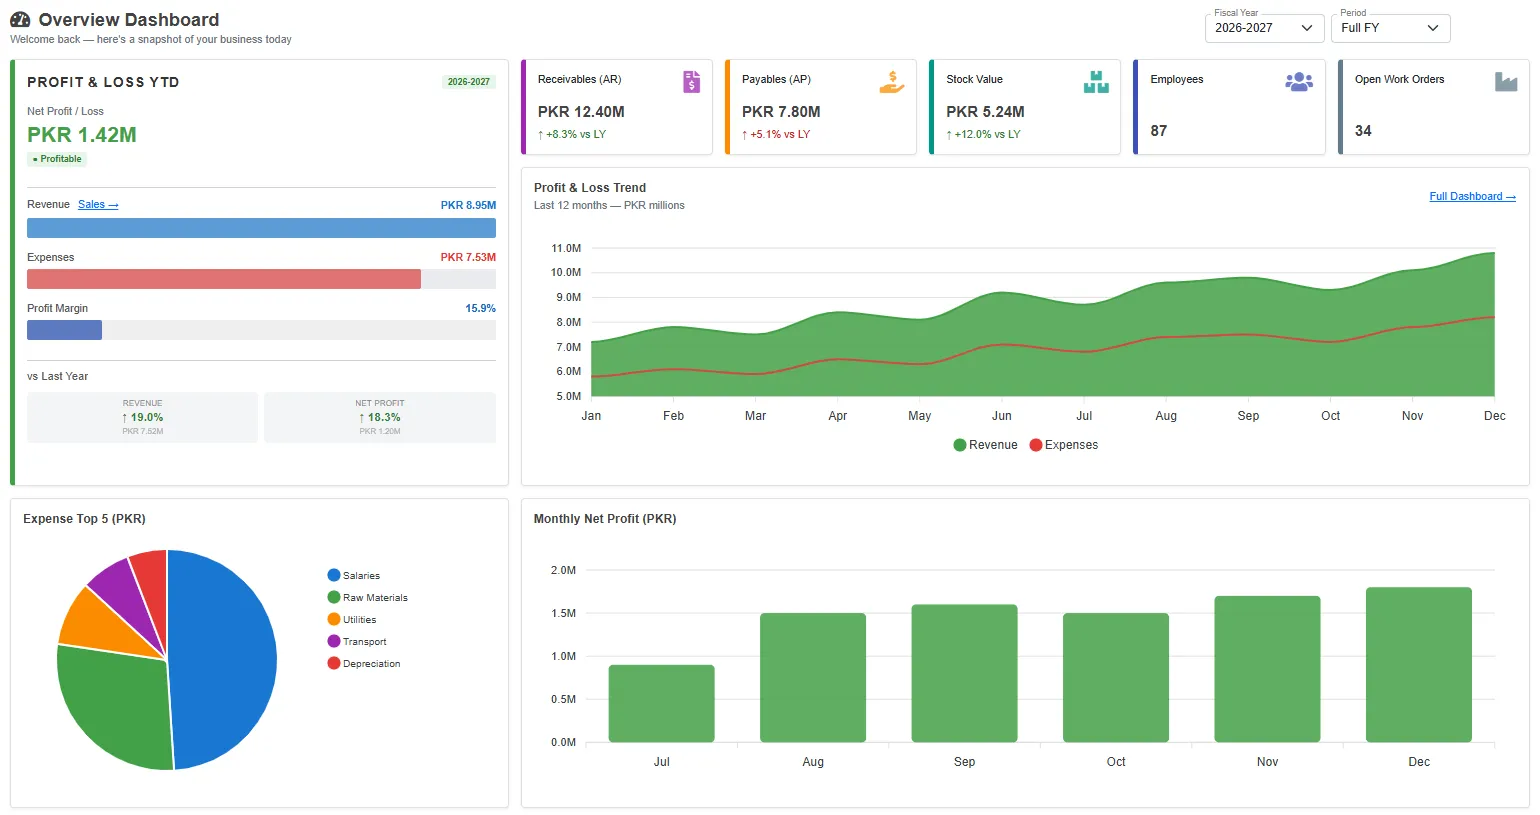
The whole business on one screen, before anyone has prepared anything.
- Headline numbers across the whole business
- What you're owed against what you owe
- Jobs in progress
- Profit and loss over twelve months
- Cash and bank balances
- Debt by age
- Monthly net profit
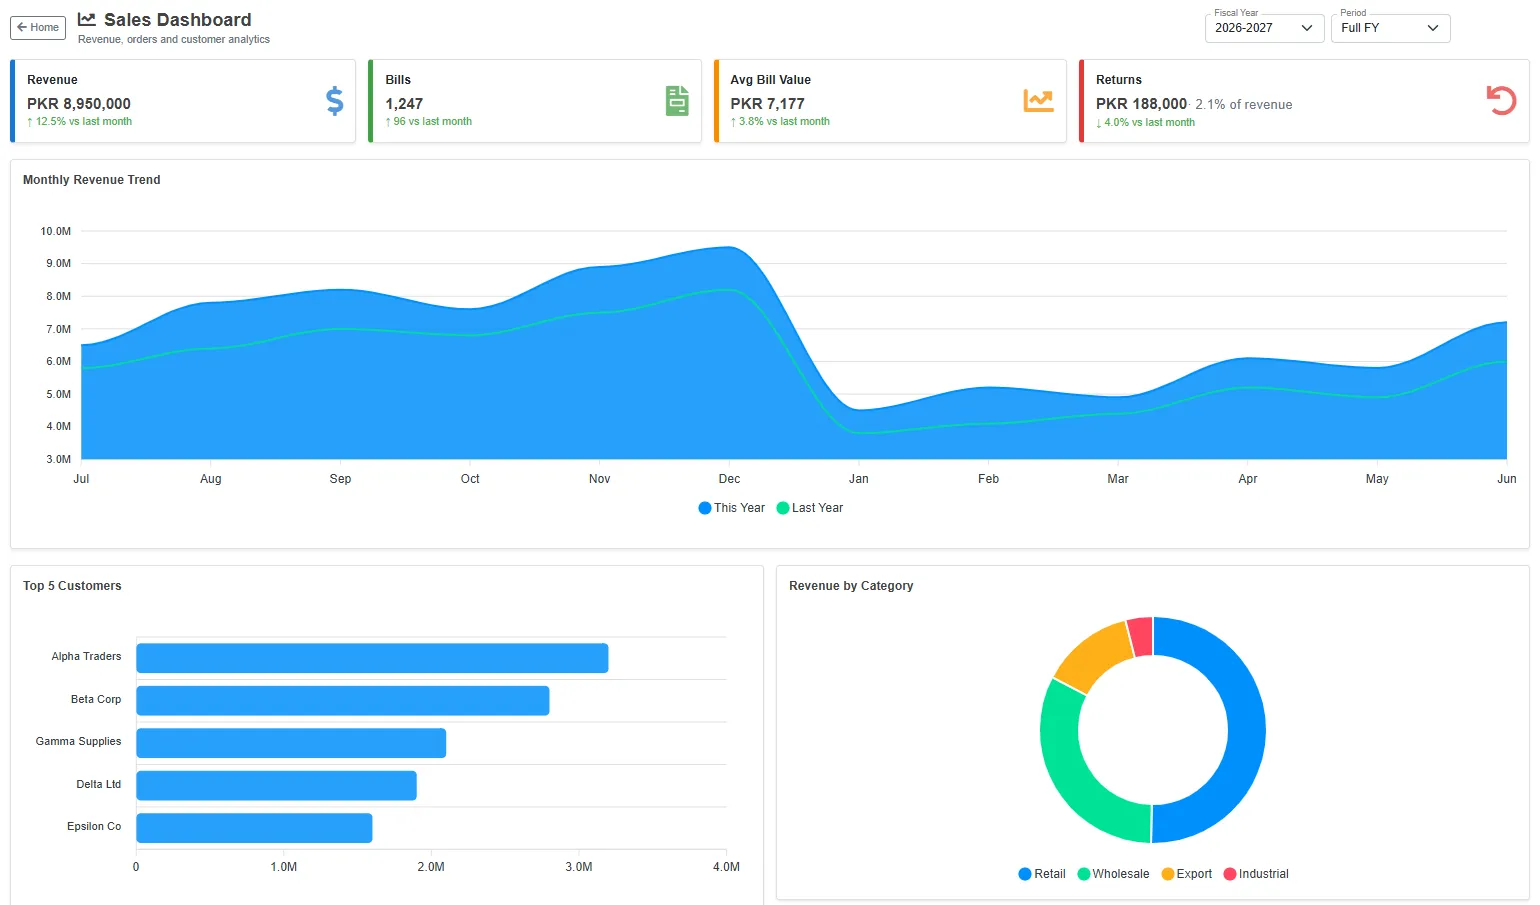
Revenue, customers and products — this year against last.
- Revenue month by month, against the same months last year
- Best customers and best-selling products
- Revenue by category
- This month against last month
- Sales by salesperson
- Which invoices are paid, due and overdue
- How much of what's ordered actually ships on time
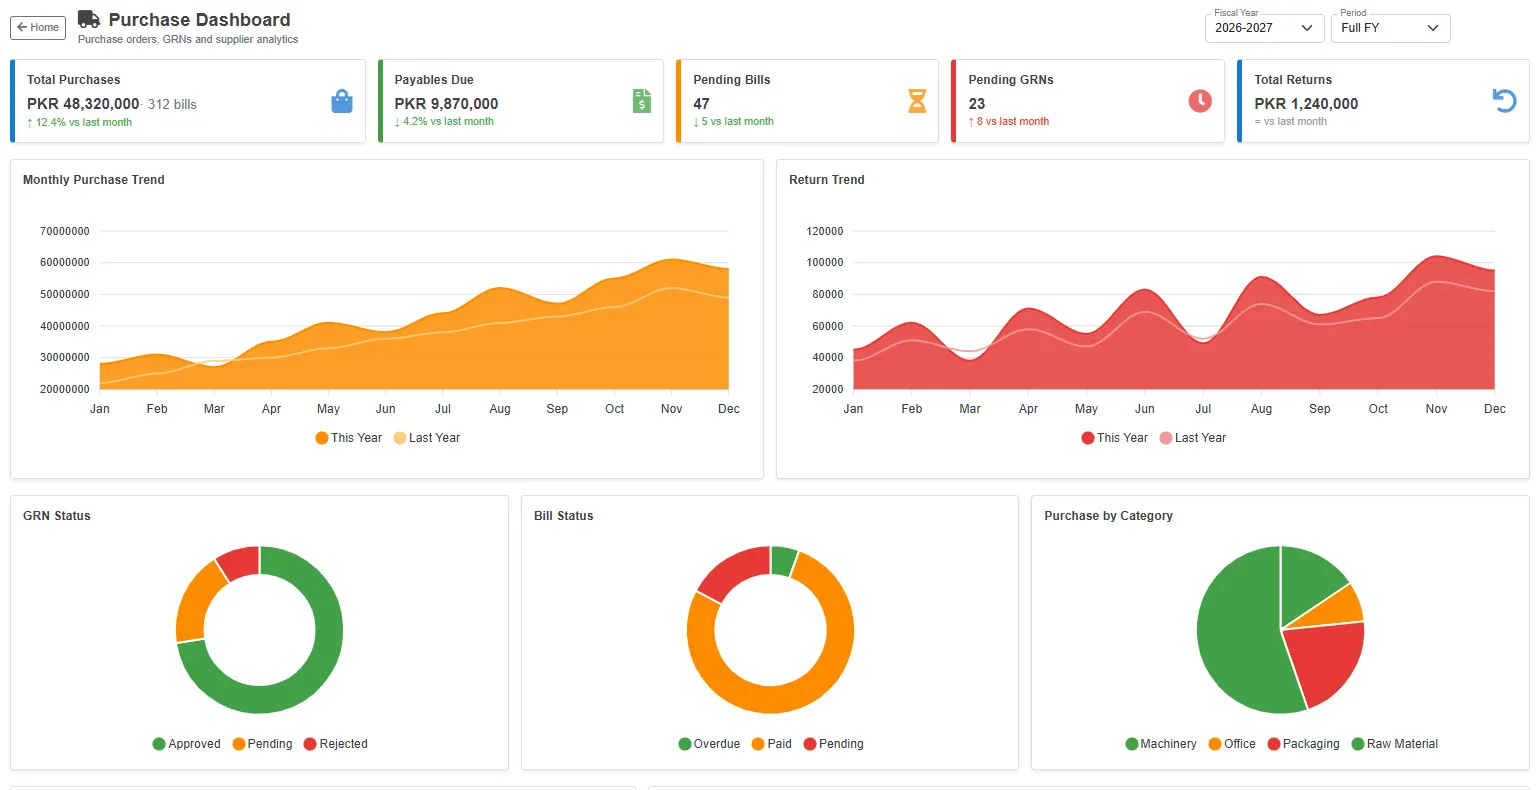
Where the spend goes, and which suppliers actually deliver.
- Spend month by month, against last year
- Biggest suppliers
- What's been received and what's been billed
- Spend by category
- Which suppliers deliver on time
- This month against last month
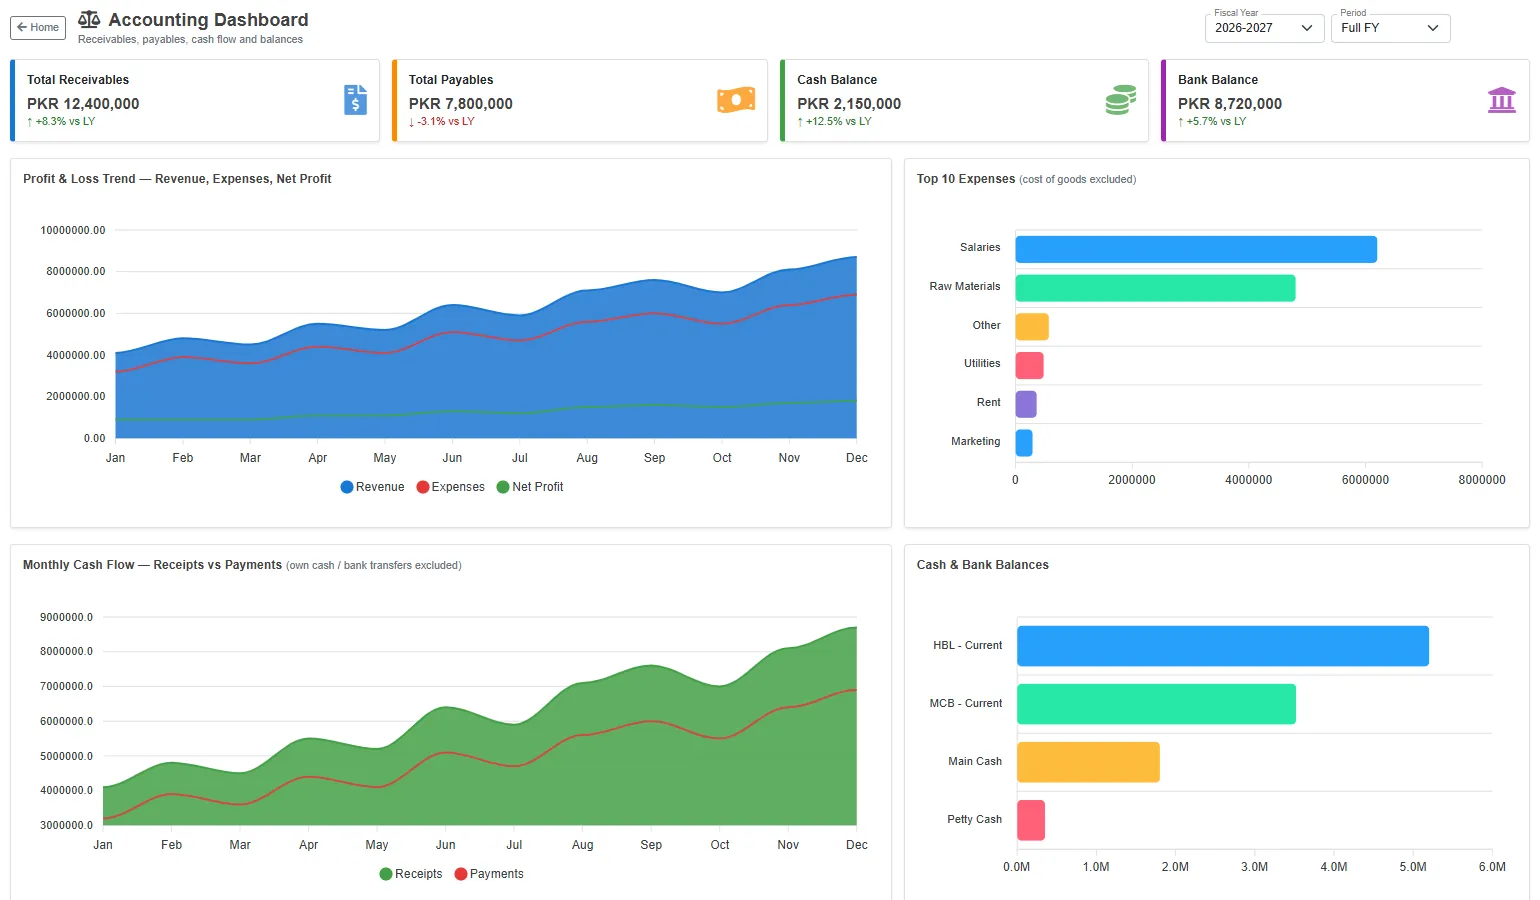
Cash, profit and debt without waiting for a month-end pack.
- Money in against money out, month by month
- Balance in every cash and bank account
- What you're owed against what you owe
- Profit and loss over twelve months, and monthly net profit
- Where the money goes — expenses broken down
- Debt by customer and by supplier, bucketed by age
- Trial balance at a glance
- Who owes you most, and who you owe most
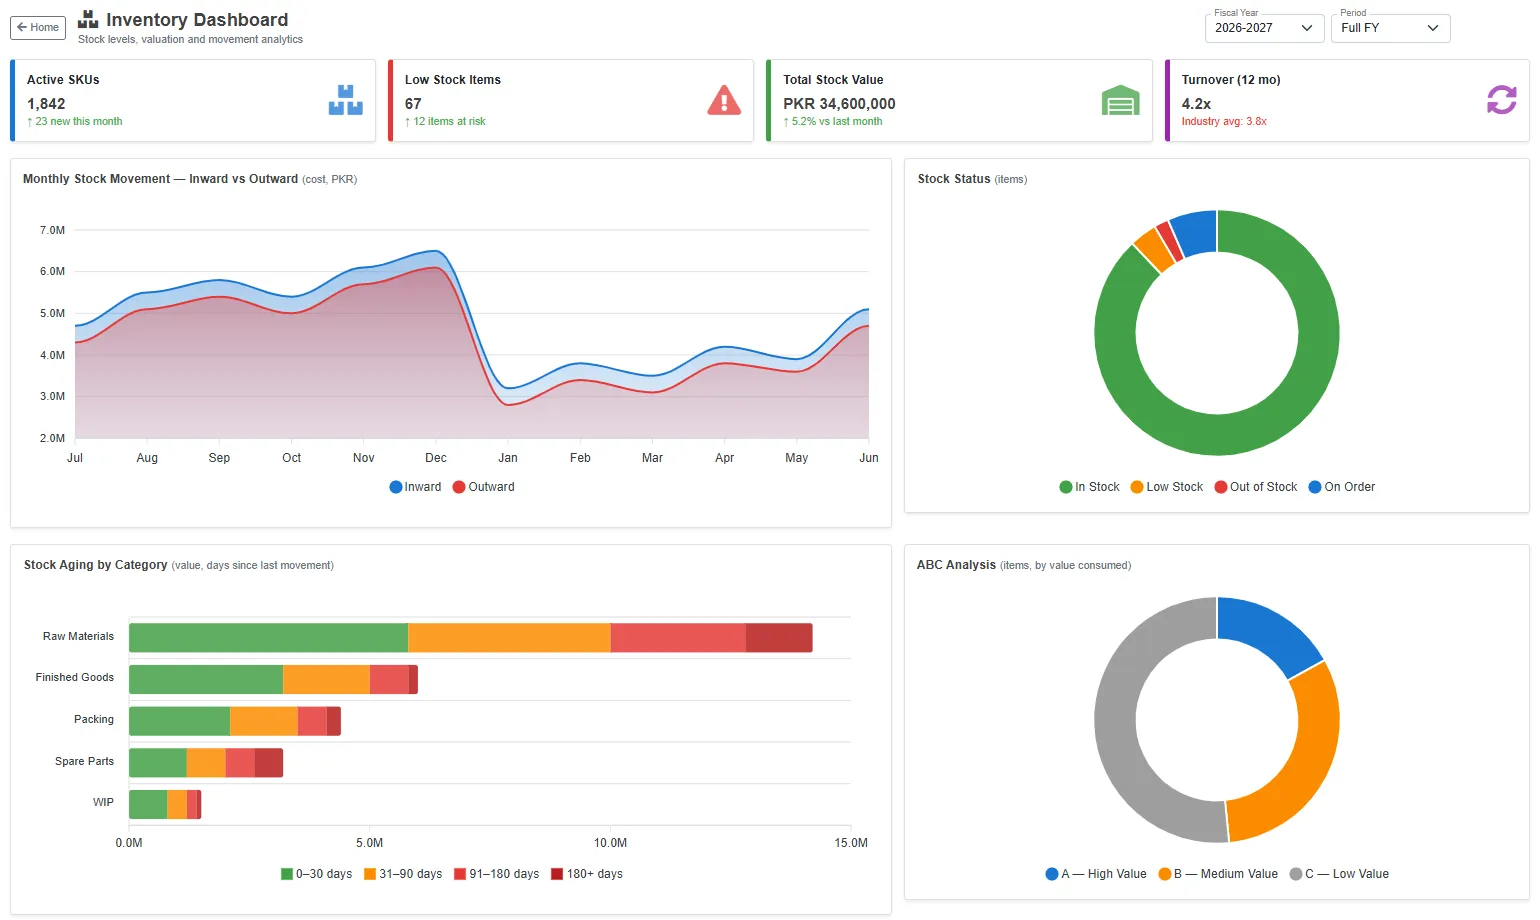
What is moving, what is stuck, and what needs reordering.
- Stock in against stock out, month by month
- Stock value by category
- How much is healthy, slow, or sitting still
- Which items are worth watching and which aren't
- Fastest-moving items
- Dead stock by category
- What needs reordering
- How long stock has been sitting, by category
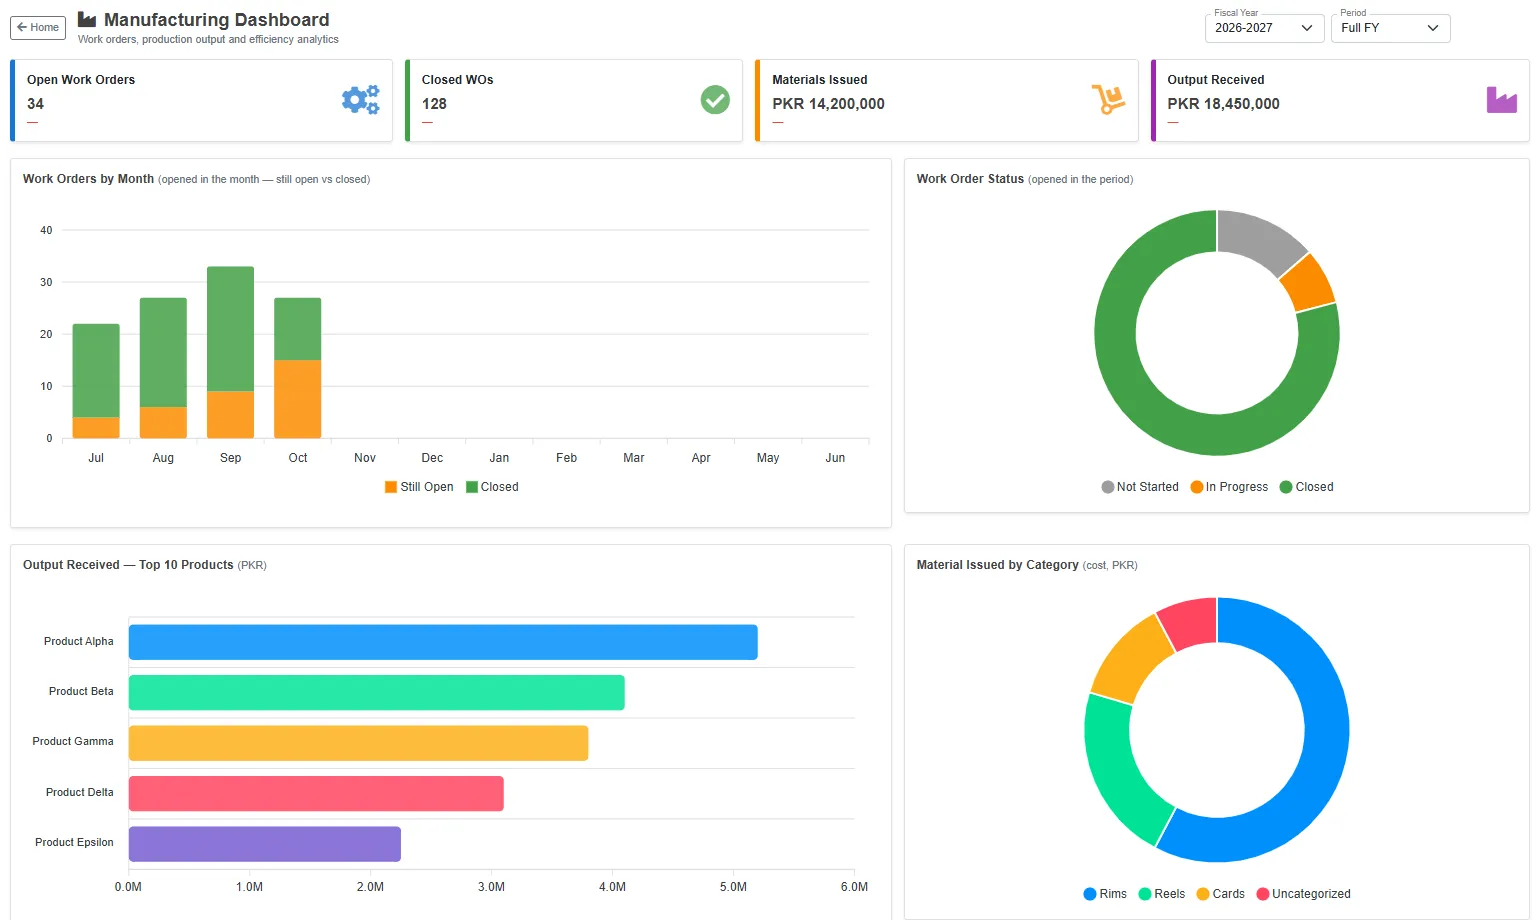
What's on the floor, what's been made, and who made it.
- Open and closed work orders, month by month
- Work orders by status
- Material issued and output received, in value
- Output by product
- Material issued by category
- Output by contractor
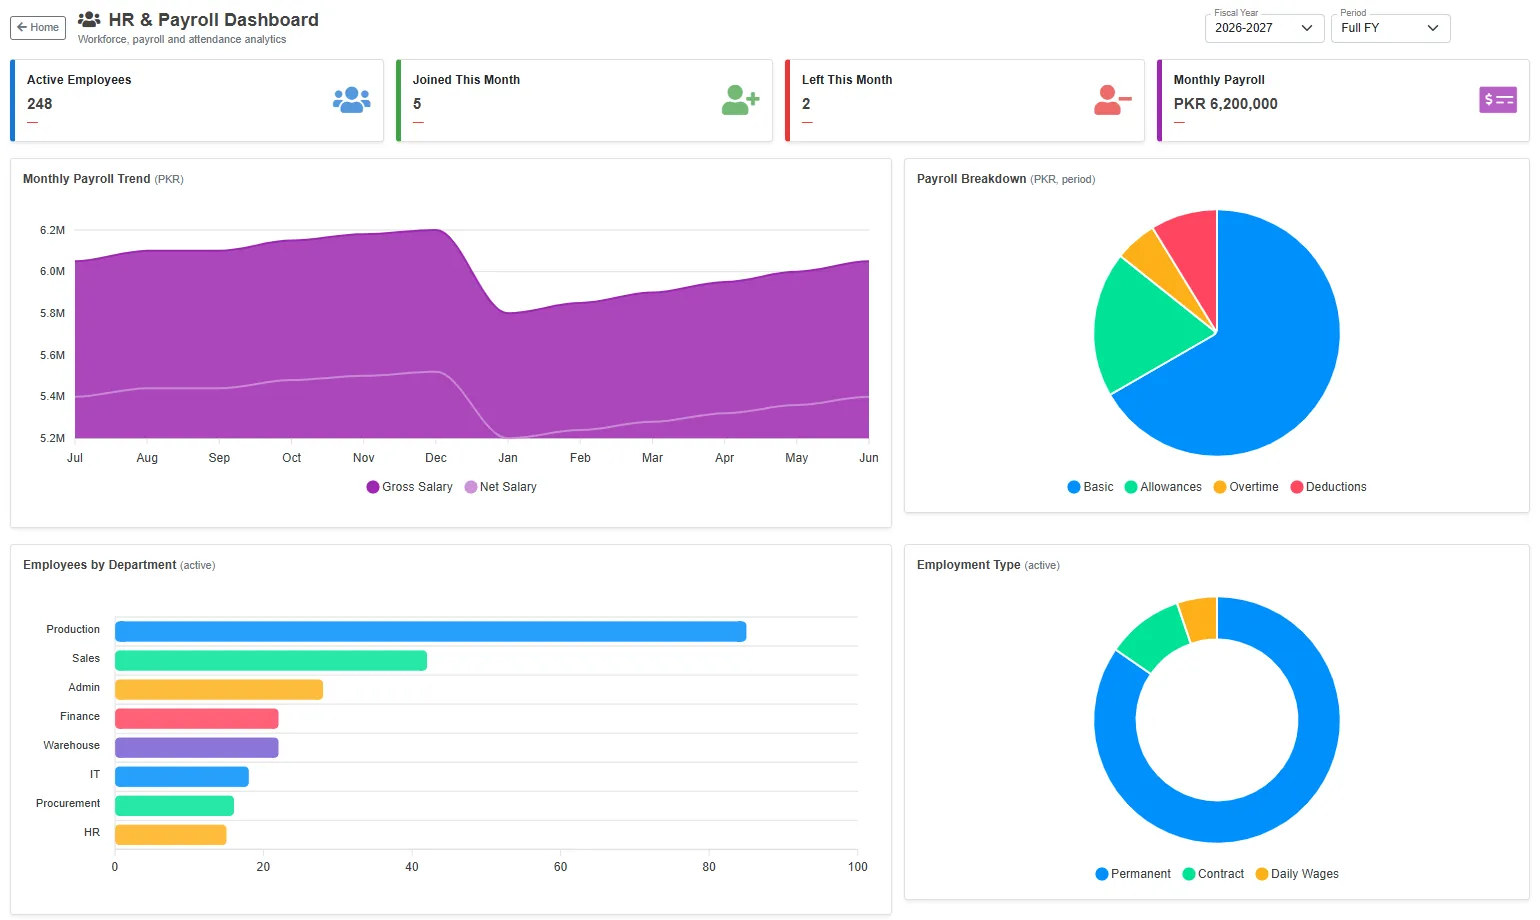
Headcount, payroll cost and leave, without asking HR for a report.
- Active employees, joiners and leavers this month
- Payroll cost month by month, gross against net
- Payroll broken down into basic, allowances, overtime and deductions
- Headcount by department
- Permanent, contract and daily-wage staff
- Joiners against leavers, month by month
- Leave taken, by type
See it working with your own numbers.
Bring a month of your real documents to the demo. We will show you the ledger entries they produce, and the reports they land in.