The Overview dashboard
After you log in, PrixERP opens the Overview Dashboard. To come back to it from any screen, click Dashboard at the top of the left strip.
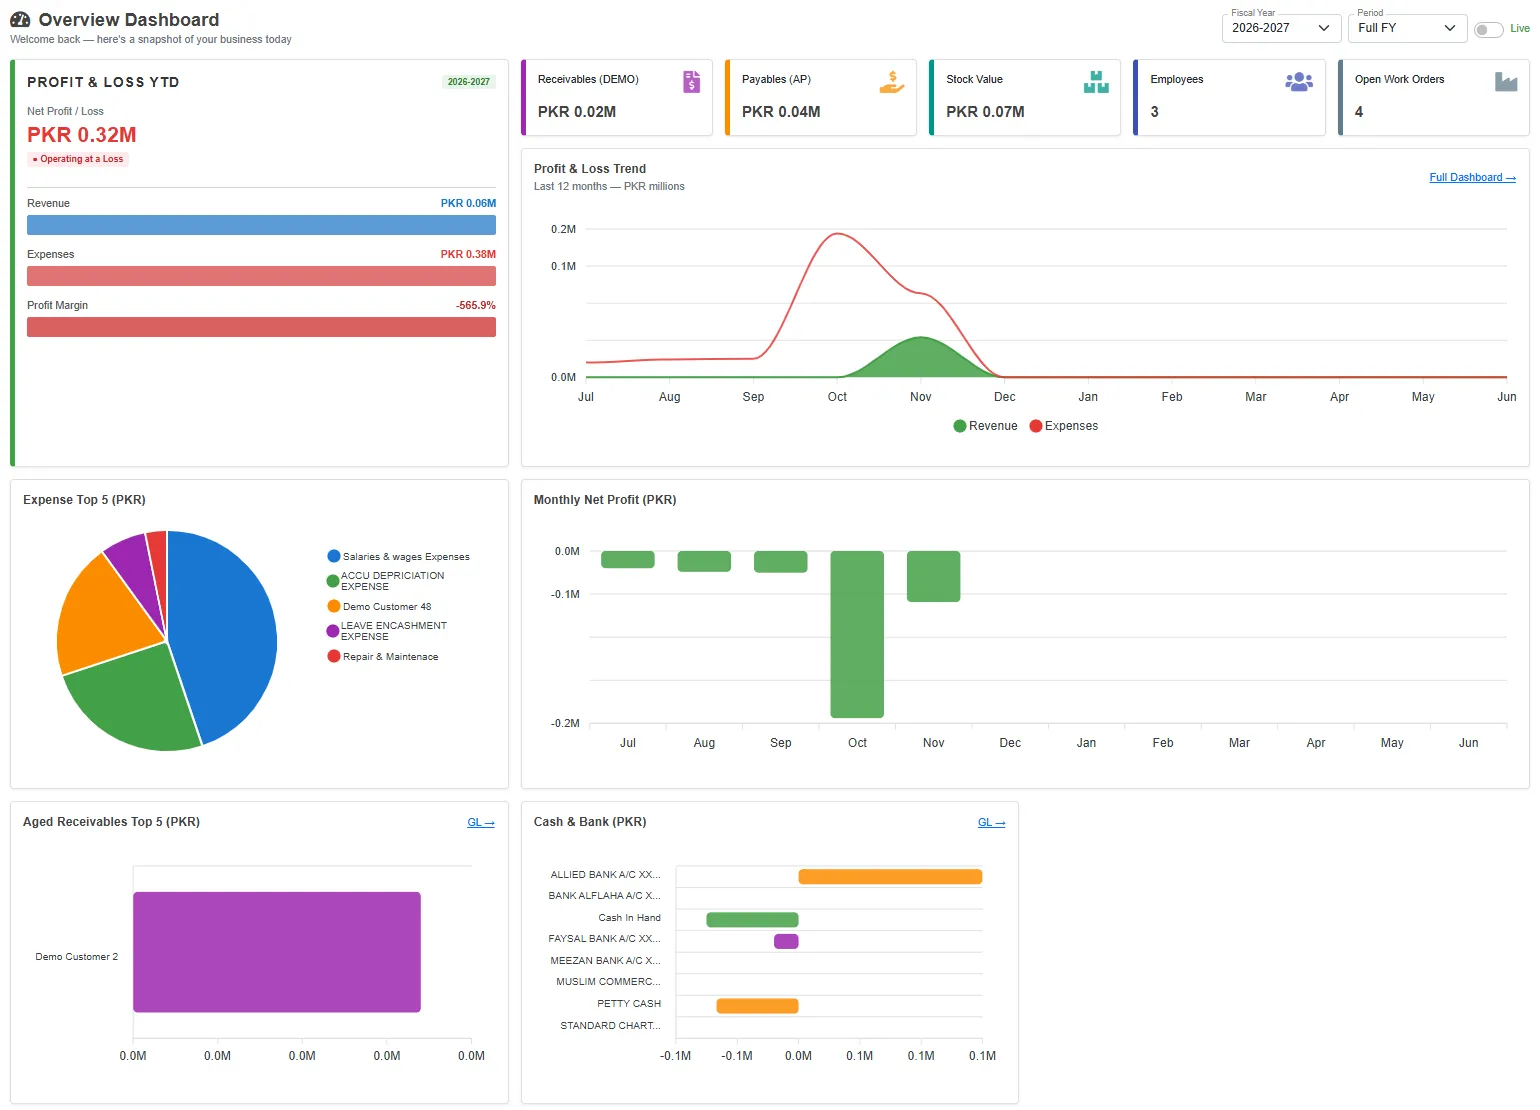
| Part | What it shows |
|---|---|
| Profit & Loss YTD | The net profit or loss for the period, with the revenue, the expenses and the profit margin under it. A loss shows in red with Operating at a Loss. Click the card to open the Accounting dashboard, or Sales → beside Revenue to open the Sales dashboard. |
| Receivables (AR) | What customers owe, from their GL balances. Opens the Accounting dashboard. |
| Payables (AP) | What you owe suppliers. Opens the Purchase dashboard. |
| Stock Value | The balance of the stock account in the GL. Opens the Inventory dashboard. |
| Employees | The number of employees. Opens the HR & Payroll dashboard. |
| Open Work Orders | Work orders not yet closed. Opens the Manufacturing dashboard. |
| Profit & Loss Trend | Revenue and expenses month by month over the fiscal year. Full Dashboard → opens the Accounting dashboard. |
| Expense Top 5 | The five largest expense accounts. |
| Monthly Net Profit | Revenue less expenses for each month. Bars below zero are months with a loss. |
| Aged Receivables Top 5 | The five customers who owe the most. |
| Cash & Bank | The balance of each cash and bank account. A bar left of zero is an account in credit (overdrawn). |
All money is in PKR. Figures in millions show as, for example, PKR 0.32M.
The filters at the top
Every dashboard has the same controls at the top right.

| Control | What it does |
|---|---|
| Fiscal Year | The year the dashboard covers. |
| Period | Full FY (the default), This Month, Last Month, Last 3 Months, Last 6 Months, Last 12 Months or Custom. Custom opens From and To dates. |
| Live switch | Leave it off. Switched on, the label turns to Dummy and the dashboard shows made-up sample figures for a demonstration. Switch it back off to see your own figures. |
| Home | On a module dashboard, the button left of the title goes back to the Overview dashboard. |
How the period is used:
- Totals (purchases, materials issued, payroll and so on) cover the chosen period.
- Balances (receivables, payables, cash, stock) are worked out as at the end of the period, or today if that is earlier.
- This month means the month of that date; last month the one before.
- Trend charts always show the twelve months of the fiscal year, July to June, whatever the period.
Hover over a chart to see the exact figures. Click a name in a chart's legend to hide or show that series.
The module dashboards
| Dashboard | Opened from |
|---|---|
| Accounting dashboard | The Profit & Loss YTD, Receivables card, or Full Dashboard → |
| Sales dashboard | Sales → beside Revenue on the Profit & Loss YTD card |
| Purchase dashboard | The Payables (AP) card |
| Inventory dashboard | The Stock Value card |
| Manufacturing dashboard | The Open Work Orders card |
| HR & Payroll dashboard | The Employees card |
The money figures that come from the General Ledger (profit, receivables, payables, cash, bank and stock value) count posted vouchers only. A document that is saved but not yet posted does not show in them.