Open it
On the Overview dashboard, click the Payables (AP) card. The Fiscal Year, Period and Live controls work as described there.
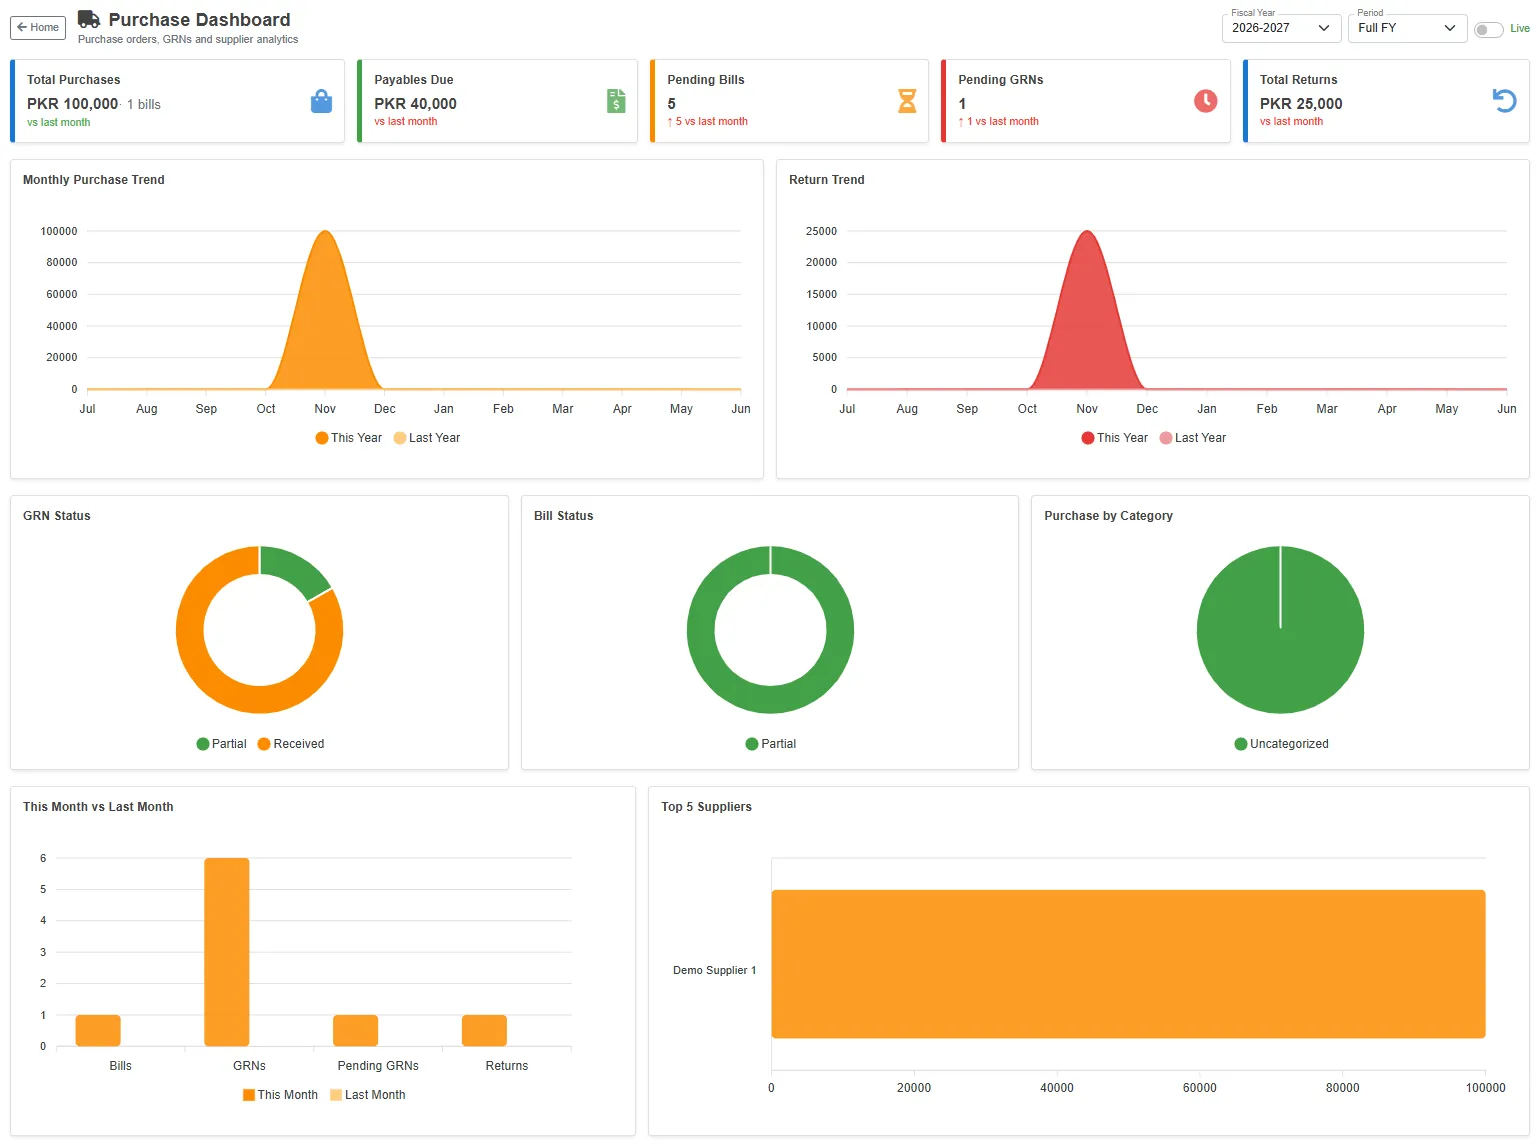
The cards
Under each figure, the small line compares this month with last month (an arrow and the change).
| Card | What it shows |
|---|---|
| Total Purchases | The purchase bills of the period, with how many bills. |
| Payables Due | What you owe suppliers, from their GL balances, as at the end of the period. |
| Pending Bills | Goods receipts (GRNs) of the period not yet billed in full. |
| Pending GRNs | Purchase orders of the period with goods still to receive. |
| Total Returns | The purchase returns of the period. |
For payables, pending items and returns, a rise is shown in red: lower is better.
The charts
| Chart | What it shows |
|---|---|
| Monthly Purchase Trend | Purchases each month of the fiscal year, against the same months a year earlier (Last Year). |
| Return Trend | The same for purchase returns. |
| GRN Status | The purchase orders of the period by how much has been received: Pending (nothing yet), Partial, Received (everything) and Closed. |
| Bill Status | The bills of the period: Paid, Partial or Unpaid. A bill not yet posted counts as unpaid. |
| Purchase by Category | The billed amount by product category. |
| This Month vs Last Month | How many bills, GRNs, pending GRNs and returns this month and last month. |
| Top 5 Suppliers | The suppliers you bought the most from in the period. |