Open it
On the Overview dashboard, click Sales → beside Revenue on the Profit & Loss YTD card. The Fiscal Year, Period and Live controls work as described there.
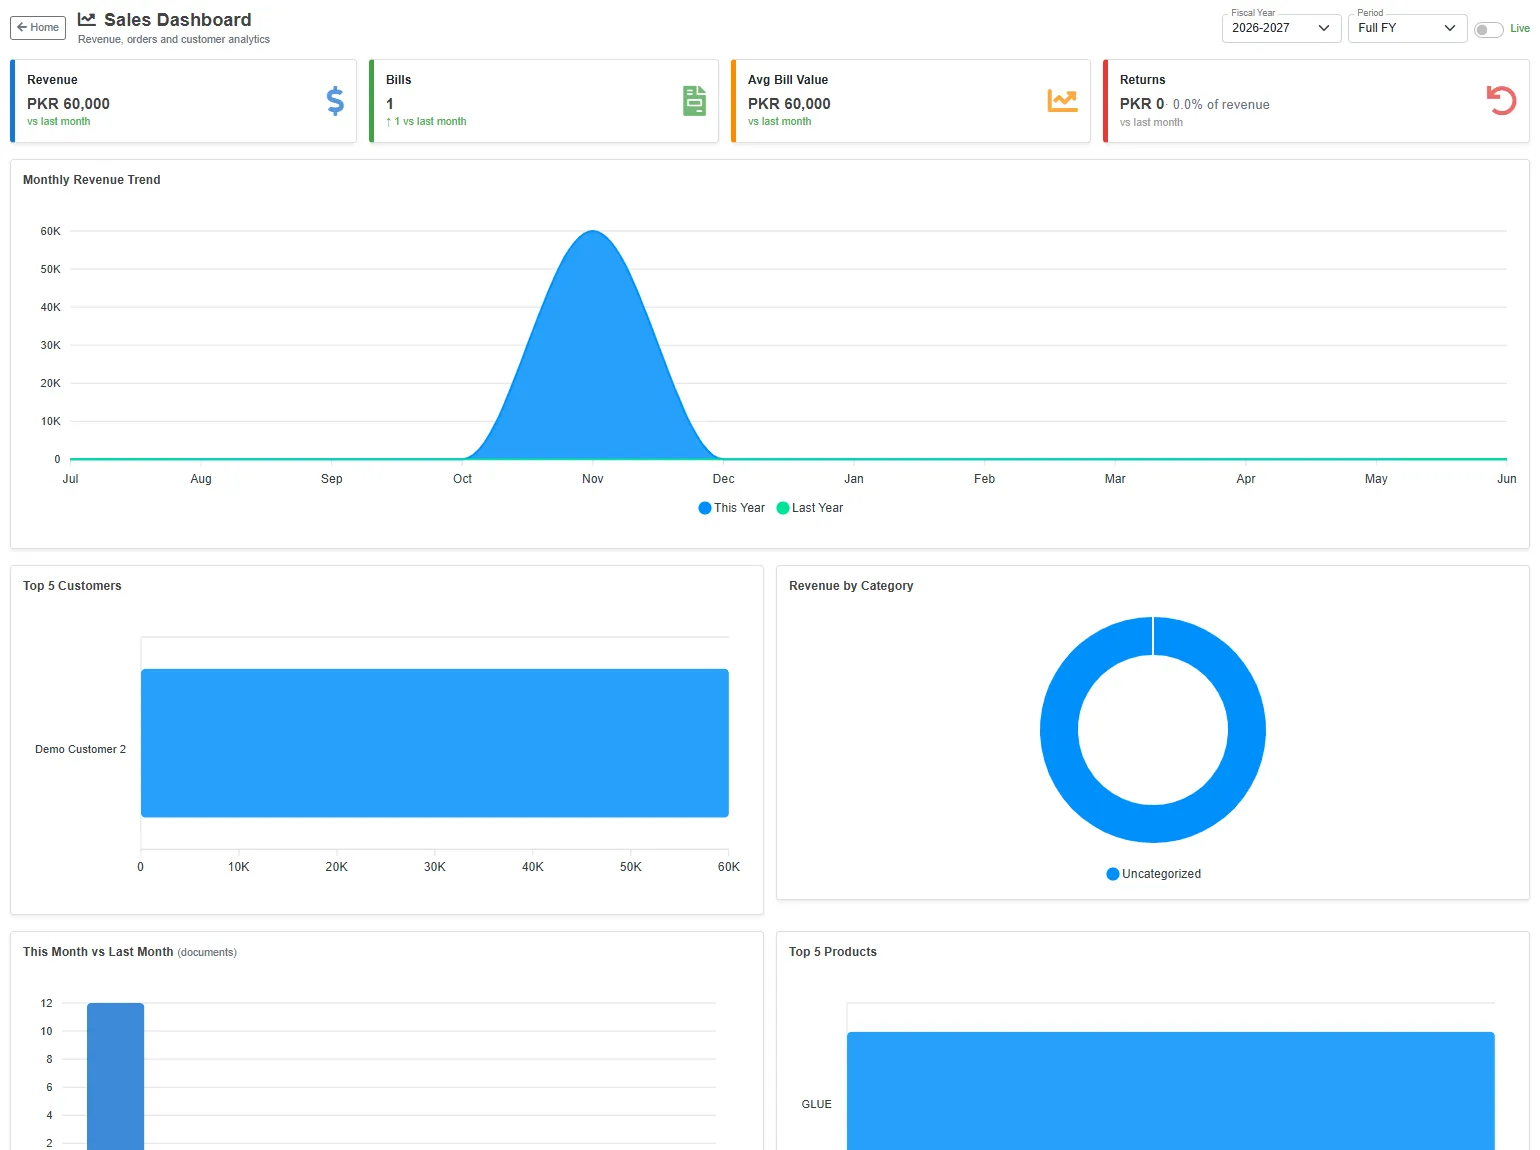
All amounts come from the lines of the sales bills, so the cards add up to the same total as the Products and Category charts.
The cards
Under each figure, the small line compares this month with last month.
| Card | What it shows |
|---|---|
| Revenue | The value of the sales bills of the period. |
| Bills | How many sales bills. |
| Avg Bill Value | Revenue divided by the number of bills. |
| Returns | The value of the sales returns of the period, and what share of revenue that is. A rise is shown in red: lower is better. |
The charts
| Chart | What it shows |
|---|---|
| Monthly Revenue Trend | Revenue each month of the fiscal year, July to June, against the same months a year earlier (Last Year). |
| Top 5 Customers | The customers billed the most in the period. |
| Revenue by Category | Revenue by product category. |
| This Month vs Last Month | How many sales Orders, delivery Challans, Bills and Returns were made this month and last month. |
| Top 5 Products | The products billed the most in the period. |
| Sales by Salesperson | Revenue by the salesman recorded on the bills. When no salesman is recorded, the card says so. |
| Invoice Status | The bills of the period: Paid, Partial or Unpaid. Customer receipts are matched to the oldest bills first, the same way as the aging report. A bill not yet posted counts as unpaid. See Account reports. |
| Orders Fully Delivered (%) | For each month, the share of that month's sales orders whose every line has been delivered, after any goods that came back. The number in brackets under each month is how many orders were made in it. |