Open it
On the Overview dashboard, click the Stock Value card. The Fiscal Year, Period and Live controls work as described there.
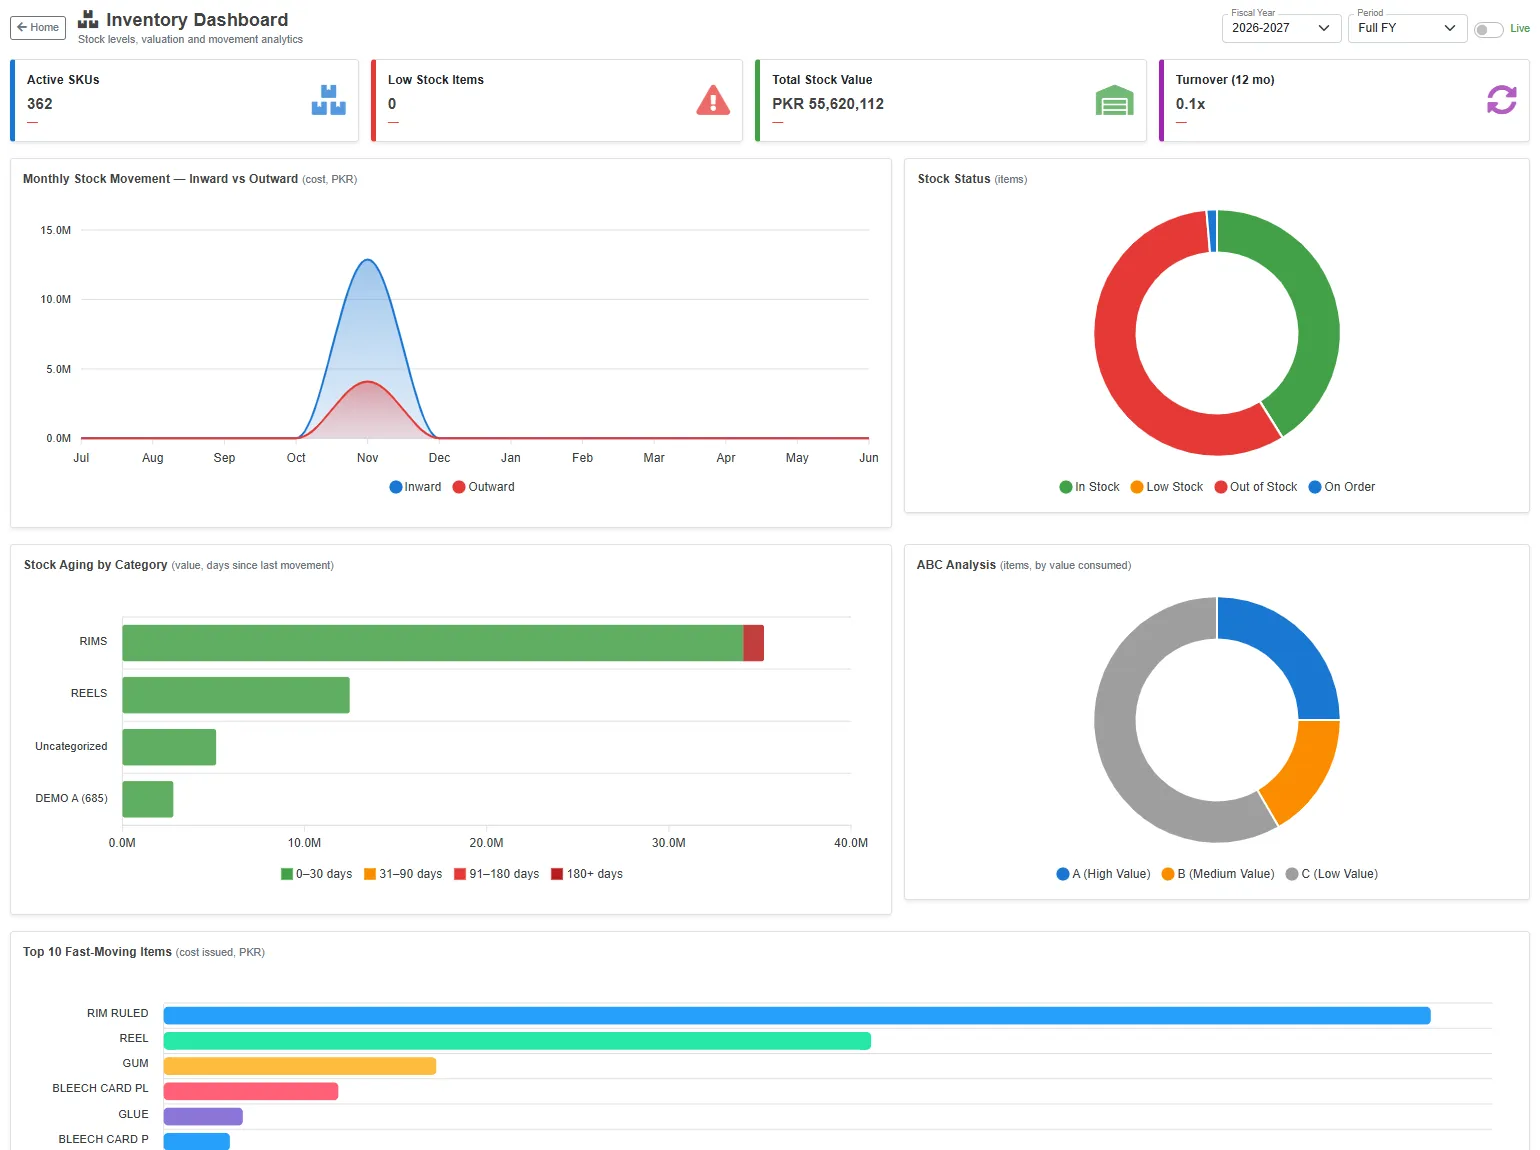
The cards
| Card | What it shows |
|---|---|
| Active SKUs | The number of products that have stock records. |
| Low Stock Items | Products at or below the reorder level set on the product. Products with no reorder level are not counted. |
| Total Stock Value | The value of the stock now, at average cost. |
| Turnover (12 mo) | The cost of stock issued in the twelve months to the end of the period, divided by the stock value now. 0.1x means a year's issues were a tenth of the stock you hold. |
The stock figures are always today's: the stock balance has no history.
The charts
| Chart | What it shows |
|---|---|
| Monthly Stock Movement | The cost of stock coming in (Inward) and going out (Outward) each month of the fiscal year. Opening balances are left out. |
| Stock Status | The products by stock: In Stock, Low Stock, Out of Stock, and On Order (on a purchase order still to be received). |
| Stock Aging by Category | The value of the stock in each category, by days since the product last moved: 0–30, 31–90, 91–180 and 180+ days. Old stock shows in red. |
| ABC Analysis | The products issued in the period, by value: A are the few that make the first 80% of the value, B the next 15%, C the rest. |
| Top 10 Fast-Moving Items | The products with the highest cost issued or delivered in the period. |
All values are in PKR, at cost. Quantities are not added up, because products are kept in different units.