What is here
Inventory Reports shows your stock in nine ways. Pick the report, choose the dates and filters, and click Show Report. Each report opens on screen, and you can print it or send it to Excel.
| Report | Use it to |
|---|---|
| Product Ledger | See every movement of one product, with the running balance. |
| Product Detail Ledger | The same, starting from the balance brought forward. |
| Product Stock Balance | See what you hold of each product today. |
| Inventory Valuation | See what your stock is worth. |
| Stock Status | See how stock moved over a period: opening, purchases, sales and closing. |
| Stock Position | Opening, in, out and closing, with the in and out split. |
| Stock Order Indication | Find products that have fallen below their reorder level. |
| Physical Stock | Print a sheet to count the stock against. |
| Employee Inventory | See what was issued to an employee or party, and returned. |
Open a report
Go to Inventory Control and click Inventory Reports under Reports. You can also click a report's name directly in the Reports list on the module page.
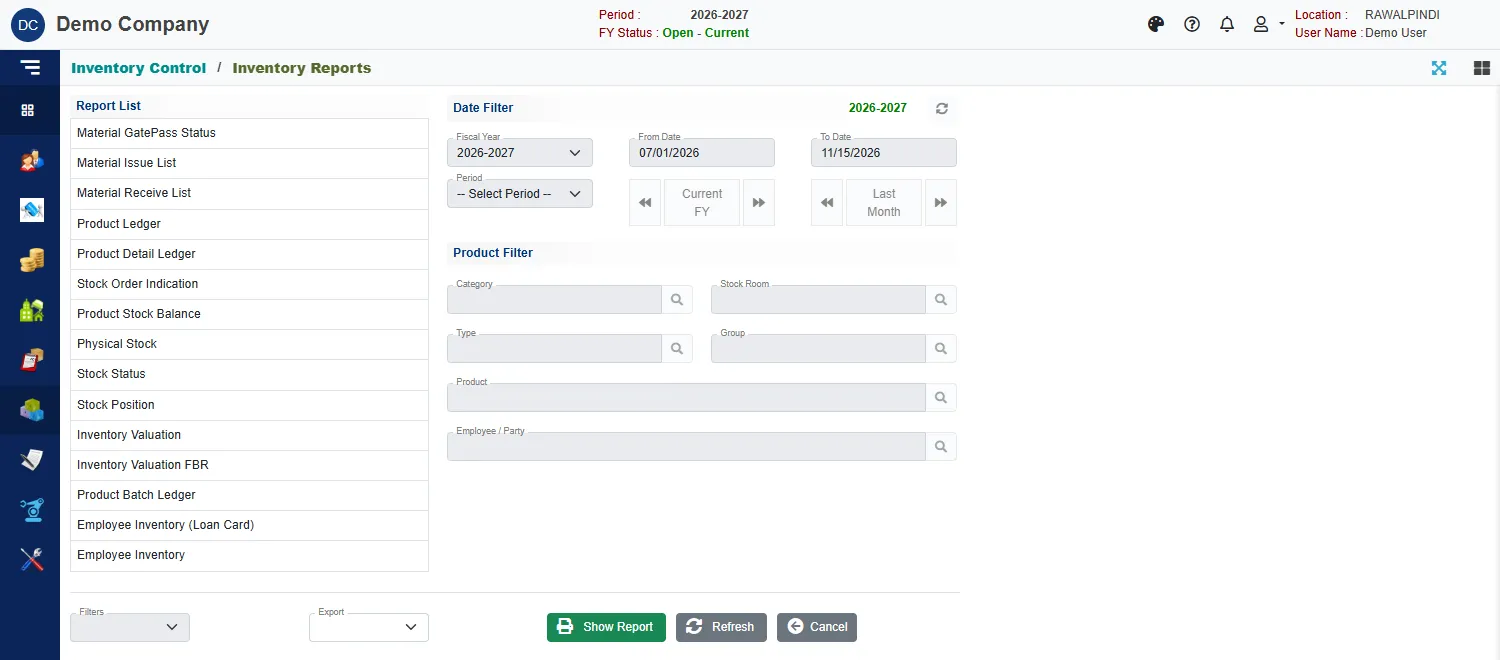
- Click a report in the Report List on the left.
- Set the dates in Date Filter. Pick the Fiscal Year, type the From Date and To Date, or choose a Period such as This Month or Last 3 Months. The buttons Current FY and Last Month fill the dates in one click, and the arrows step to the next or previous one.
- Narrow the report in Product Filter if you wish: Category, Stock Room, Type, Group, Product, and Employee / Party. Click the search button beside a box to pick a value. Only the boxes the chosen report uses can be filled; the others are greyed out.
- Click Show Report.
Some reports need a product. Product is required means you have to pick one in Product Filter first.
Working with a report
Every report has the same bar above it:
- Print prints the report.
- Excel saves it as an Excel file.
- Back returns to the filters.
- The balance and movement reports also have a search box, filters for Category, Type, Group, Assy Type and Stock Room, and a refresh button. Change a filter to narrow the report without going back. Tick Show Image to see product pictures.
Products that have variants show a small badge, for example 145 Variants. Click the product to see its variants and their figures in a window.
Product Ledger
Every movement of one product in the period, with the running balance. Pick the product, then the dates.
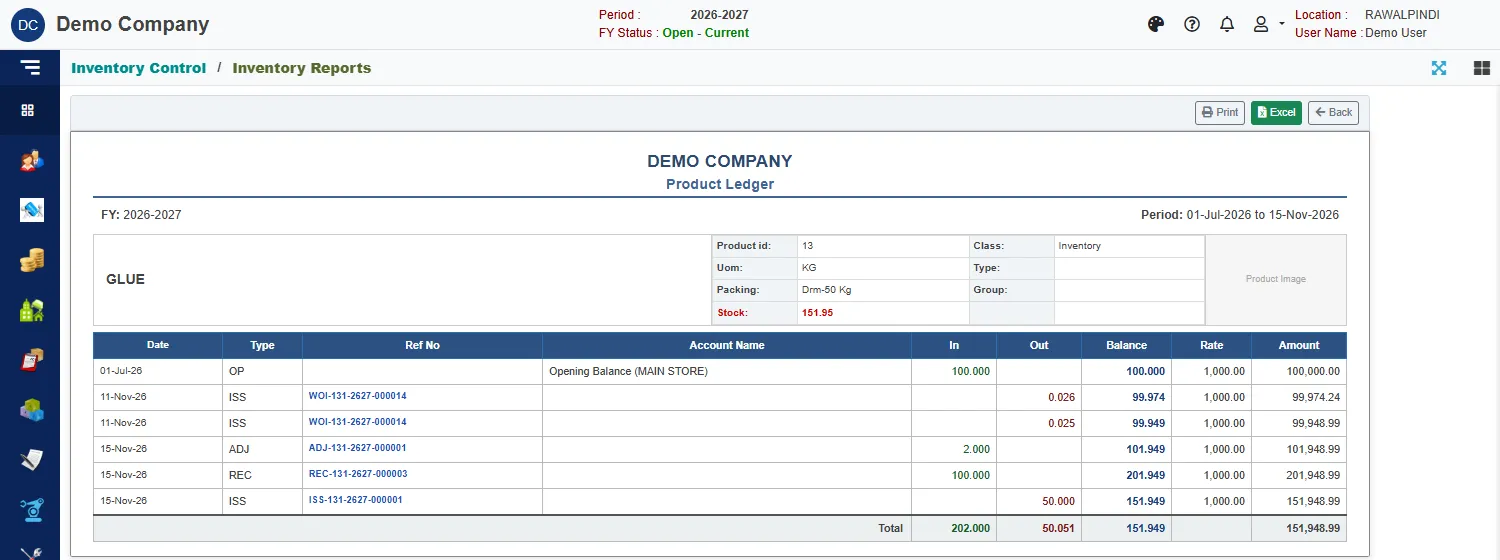
The top shows the product's id, unit, packing and its stock now. Under it, each movement has its Date, Type, Ref No, Account Name, In, Out, Balance, Rate and Amount.
| Type | Meaning |
|---|---|
| OP | The opening balance. |
| REC | A product receipt. |
| ISS | A product issue, or an issue to a work order. |
| ADJ | An adjustment. |
| GRN, DC, PR, SR | Goods received, delivery challan, purchase return, sale return. |
Click a Ref No to open the document behind the line.
Product Detail Ledger
The same movements, but the balance before the period starts as a single Balance B/F line instead of the opening row. Use it when you want the ledger to start from where the period starts.
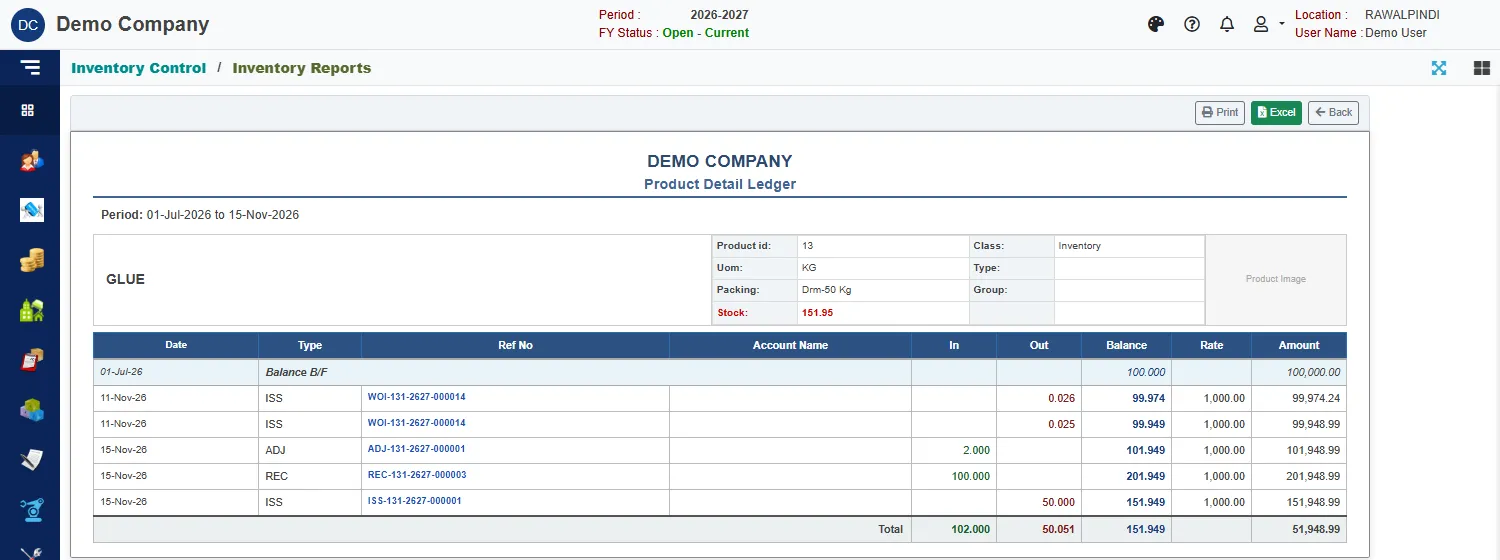
A product is required.
Product Stock Balance
What you hold of each product on the report date.
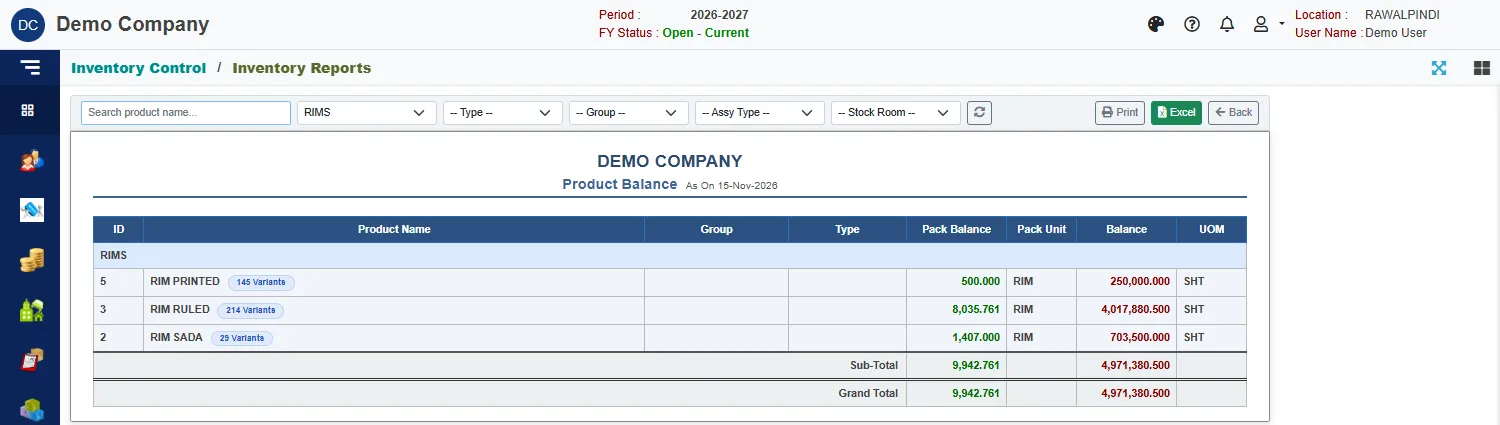
Each row shows the product's Group and Type, its Pack Balance with the Pack Unit (for example 500 rims), and the Balance in the stock unit (250,000 sheets). Products are grouped by category with a Sub-Total for each, and a Grand Total.
Inventory Valuation
What your stock is worth on the report date.
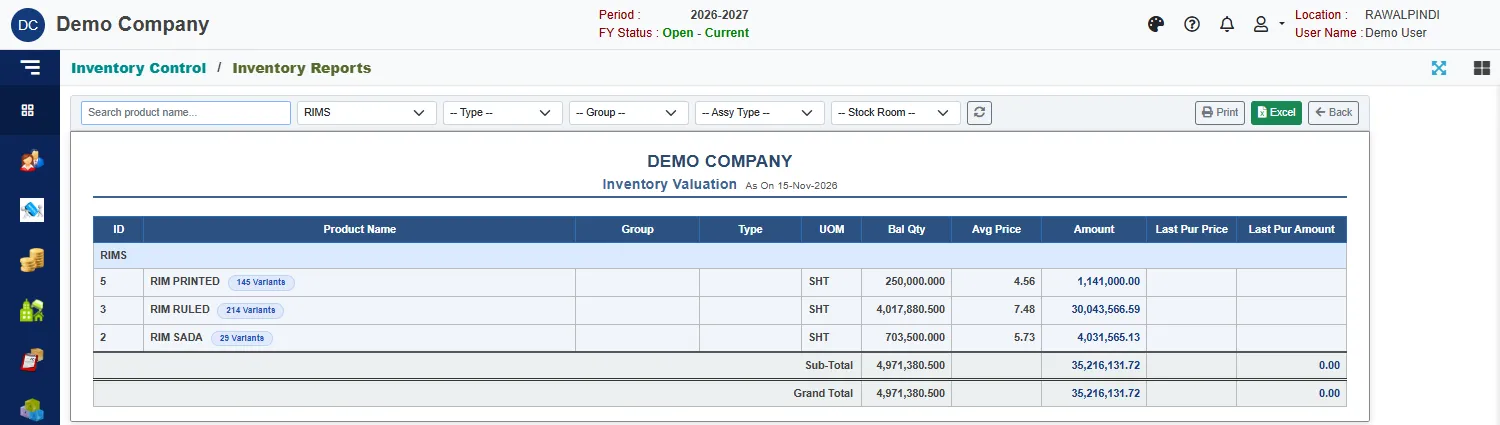
| Column | Meaning |
|---|---|
| Bal Qty | The balance. |
| Avg Price | The average cost of what you hold. |
| Amount | The balance times the average price. |
| Last Pur Price and Last Pur Amount | The price of the last purchase, and the balance valued at it. |
Each category has a Sub-Total and the report ends with a Grand Total.
Stock Status
How stock moved over the period, product by product.
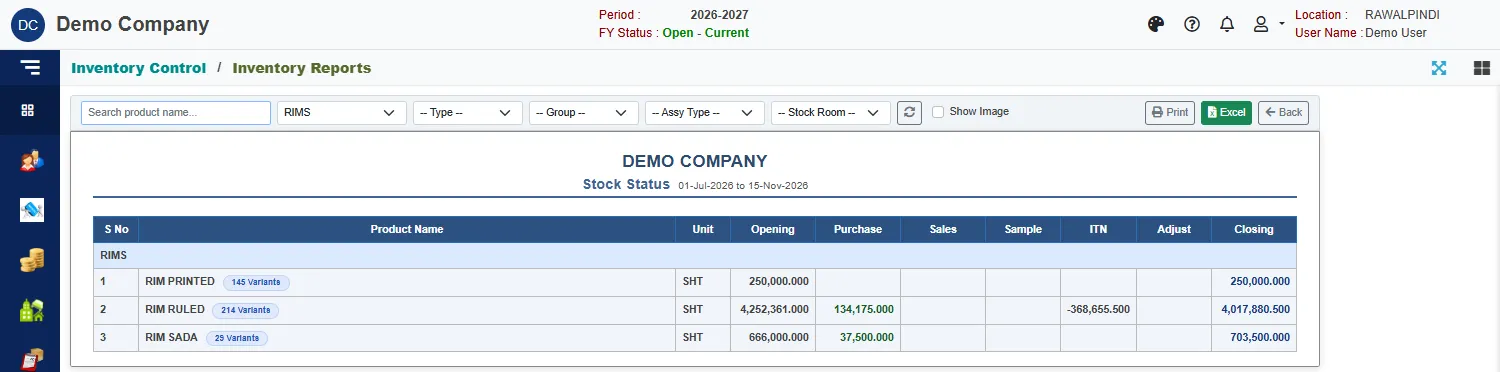
| Column | Meaning |
|---|---|
| Opening | The balance before the period starts. |
| Purchase | Goods received, less purchase returns. |
| Sales | Stock delivered to customers, less sale returns. |
| Sample | Samples given out. |
| ITN | The net of transfers between stores, product issues and product receipts. Issues show as a minus. |
| Adjust | Adjustments. |
| Closing | The balance at the end of the period. |
Stock Position
Like Stock Status, but with stock coming in and going out shown separately.
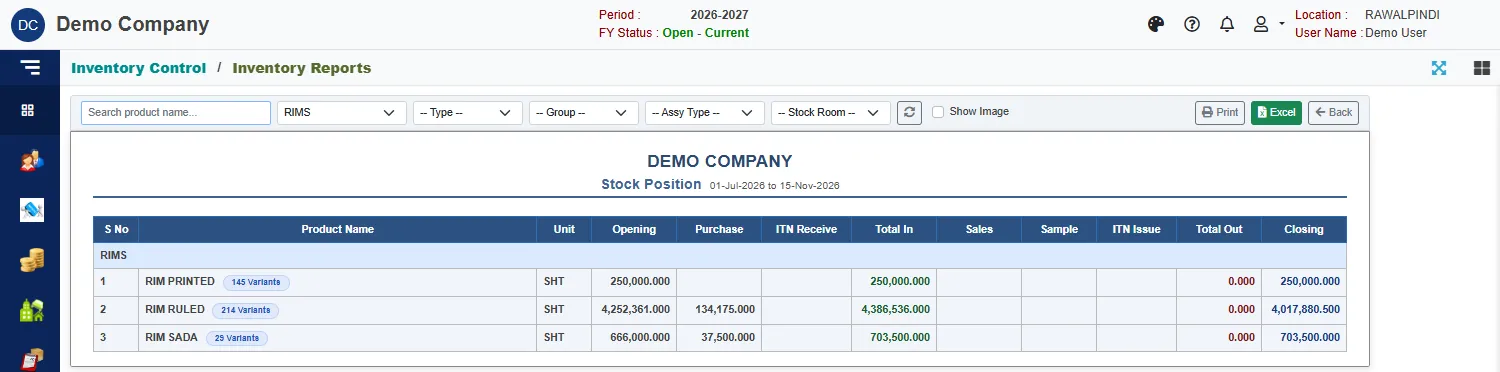
The columns are Opening, Purchase, ITN Receive, Total In, Sales, Sample, ITN Issue, Total Out and Closing.
ITN Receive and ITN Issue count transfers between stores only. Product issues, product receipts and adjustments change the Closing balance but do not appear in the in and out columns, so Opening + Total In − Total Out can differ from Closing. Use Stock Status to see them.
Stock Order Indication
Lists the products whose balance has fallen below their reorder level, so you know what to buy.
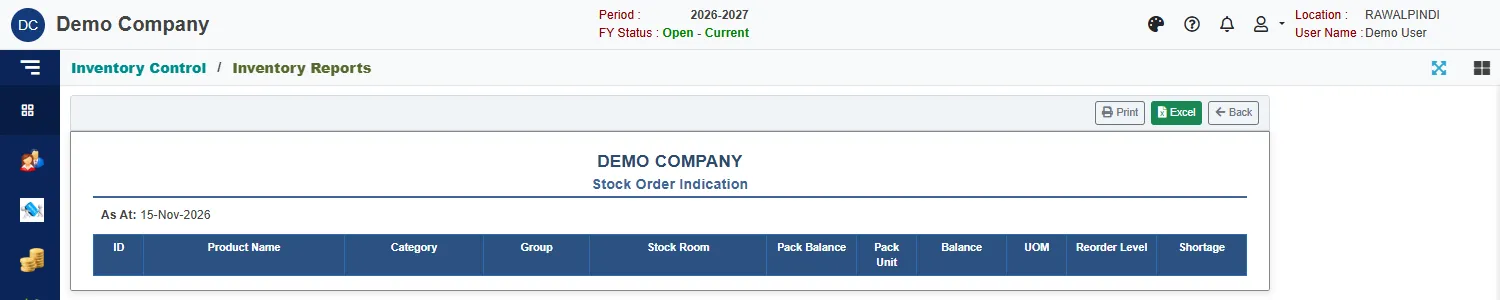
It shows the Product Name, Category, Group, Stock Room, the Pack Balance and Balance, the Reorder Level, and the Shortage, which is the reorder level less the balance. The report is as of a date. When no product is below its level, the report is empty, as above.
Physical Stock
A sheet to take to the shelves when you count stock.
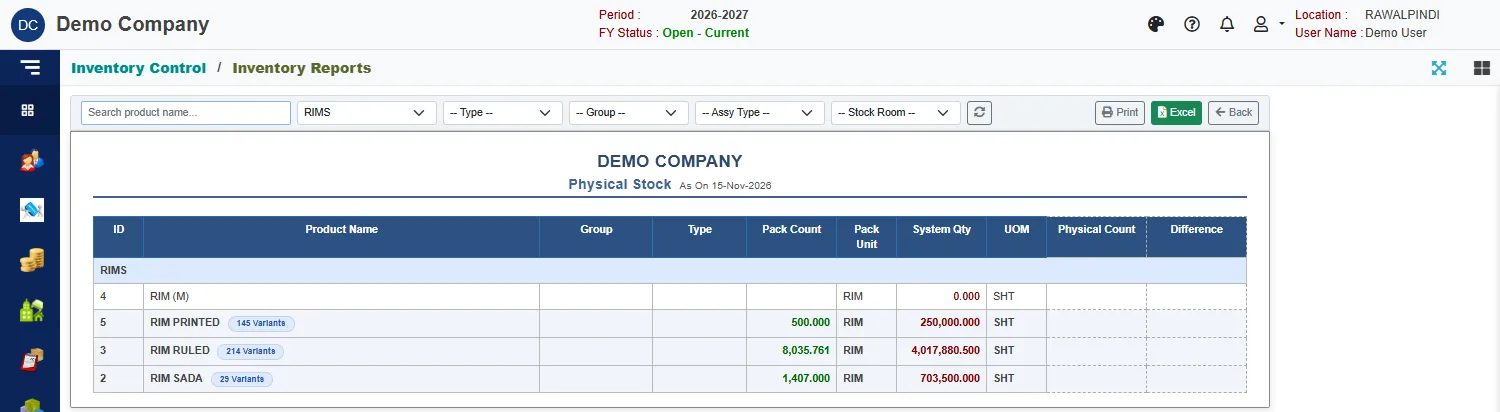
Each product shows its Pack Count and System Qty: what the system says you hold. The Physical Count and Difference columns, with dashed borders, are left empty for you to fill in by hand on the printed sheet. Print it, count, write the counts in, and work out the differences.
To put right a count that is higher than the system, use Inventory Adjustment. To take out stock that is missing, use Product Issue.
Employee Inventory
What was issued to an employee or party, and what came back. Pick the employee or party in Product Filter.
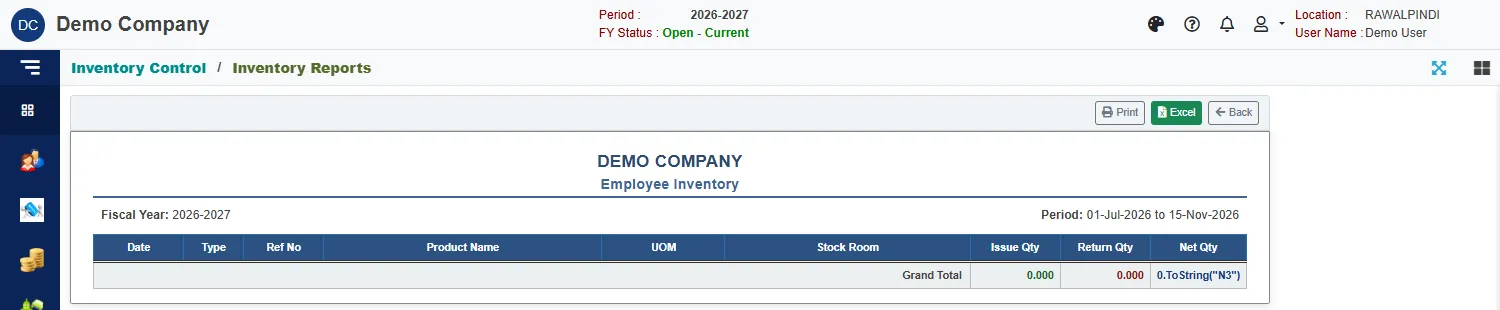
Each line shows the Date, Type, Ref No, Product Name, UOM, Stock Room, the Issue Qty, the Return Qty and the Net Qty. Totals are shown for each person and for the whole report.
Related
- Product Receive and Product Issue make the movements these reports show.
- Opening Balance sets the opening figures.